Install and Use gtop on Linux
Traducciones al EspañolEstamos traduciendo nuestros guías y tutoriales al Español. Es posible que usted esté viendo una traducción generada automáticamente. Estamos trabajando con traductores profesionales para verificar las traducciones de nuestro sitio web. Este proyecto es un trabajo en curso.
Gtop is a system monitoring dashboard for your terminal, with a rich graphical display. In this guide, you learn more about gtop and how it compares to the Linux utilities, top and htop. This guide also shows you how to install and get started using gtop on your Linux system.
Before You Begin
If you have not already done so, create a Linode account and Compute Instance. See our Getting Started with Linode and Creating a Compute Instance guides.
Follow our Setting Up and Securing a Compute Instance guide to update your system. You may also wish to set the timezone, configure your hostname, create a limited user account, and harden SSH access.
sudo. If you’re not familiar with the sudo command, see the
Linux Users and Groups guide.What is gtop?
Gtop is a graphical system monitoring dashboard for your terminal. Gtop displays your system’s memory, CPU, and disk usage at a glance in an easy-to-read visual layout. Alongside that information, you get a list of running processes with statistics about their CPU, and memory consumption.
gtop vs. htop
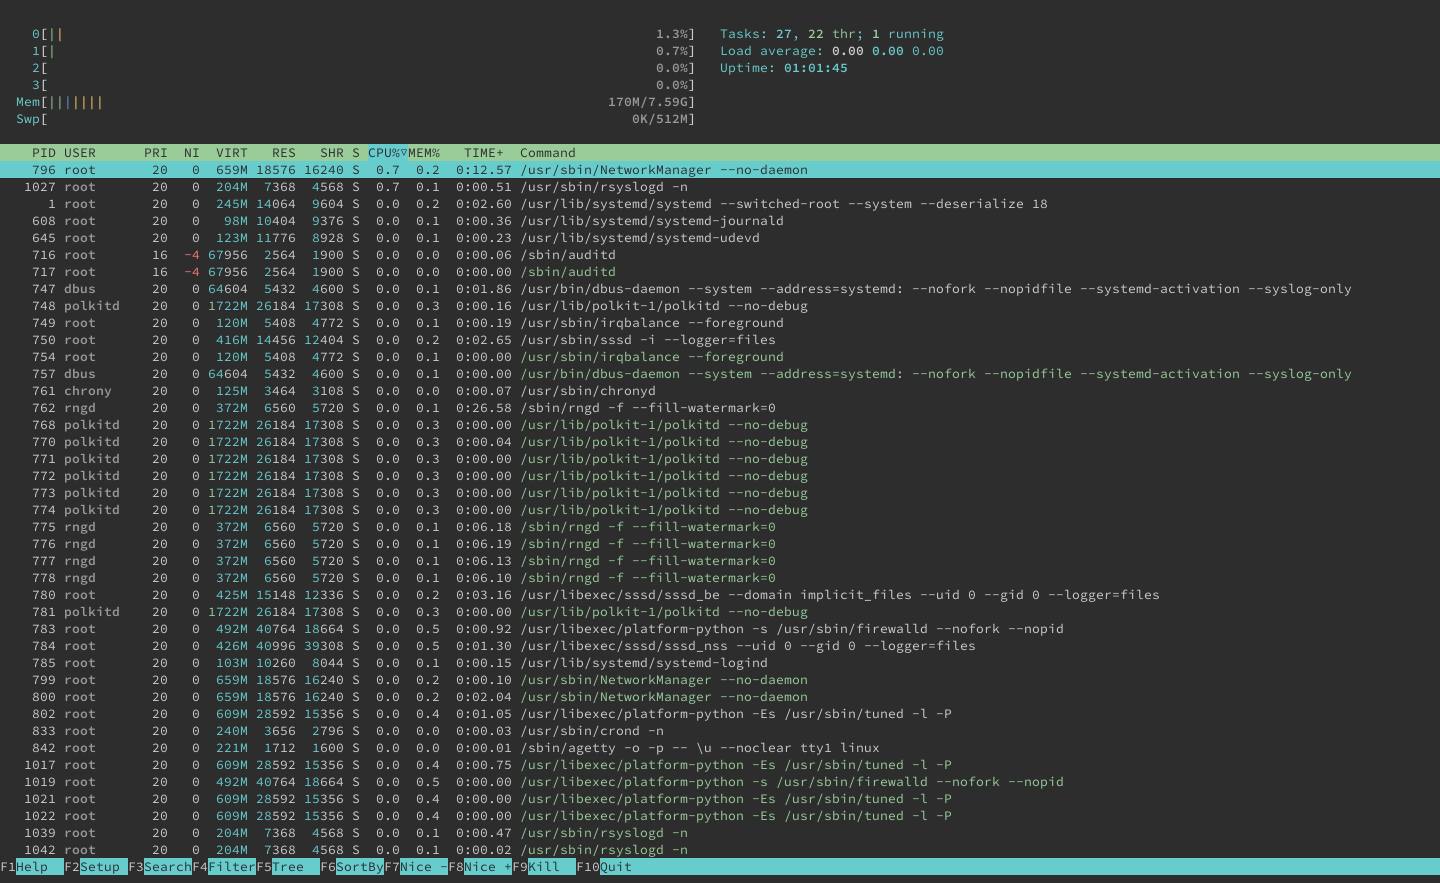
Gtop is built on the precedent of htop, which aims to be a more interactive and graphical version of top. If you are unfamiliar, top is a command included by default on most Unix systems for viewing running processes and system usage information. Htop adds vertical and horizontal scrolling, mouse input, more information about processes, and additional features.
Gtop takes up the graphical direction of htop. But unlike htop, which still focuses on listing processes, gtop seeks to provide an almost entirely graphical representation of the system’s usage information. With gtop, you get various graphs in widgets that break up your monitoring into visual sections. Gtop employs distinct coloring in its displays, making it all the more readable, too.
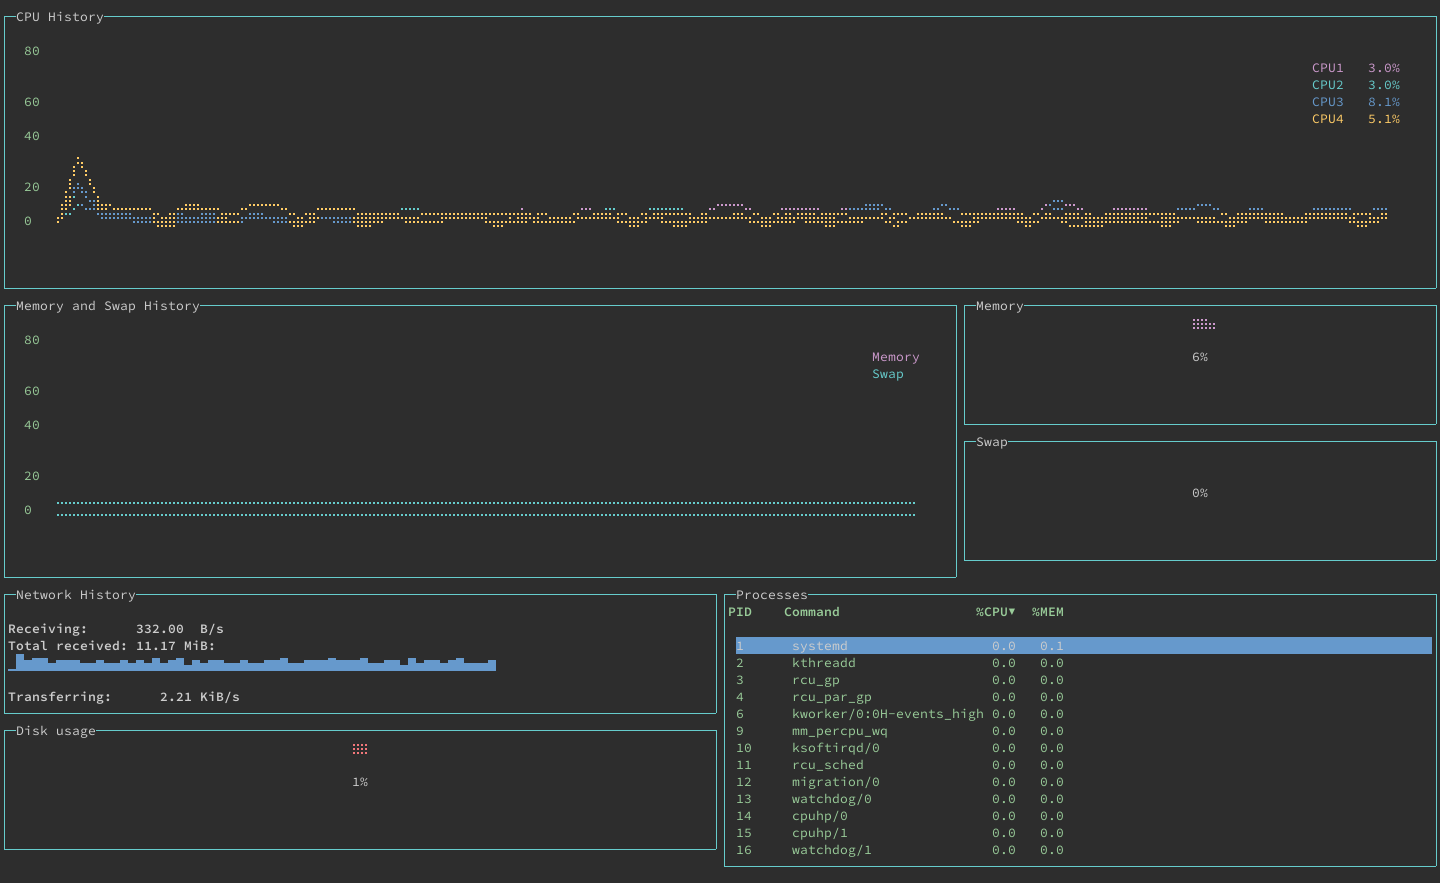
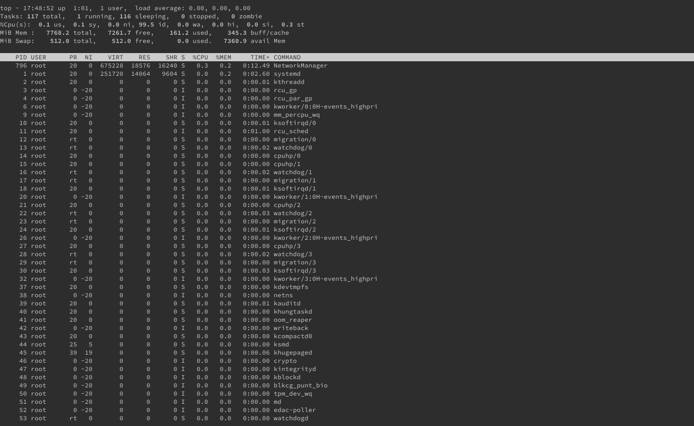
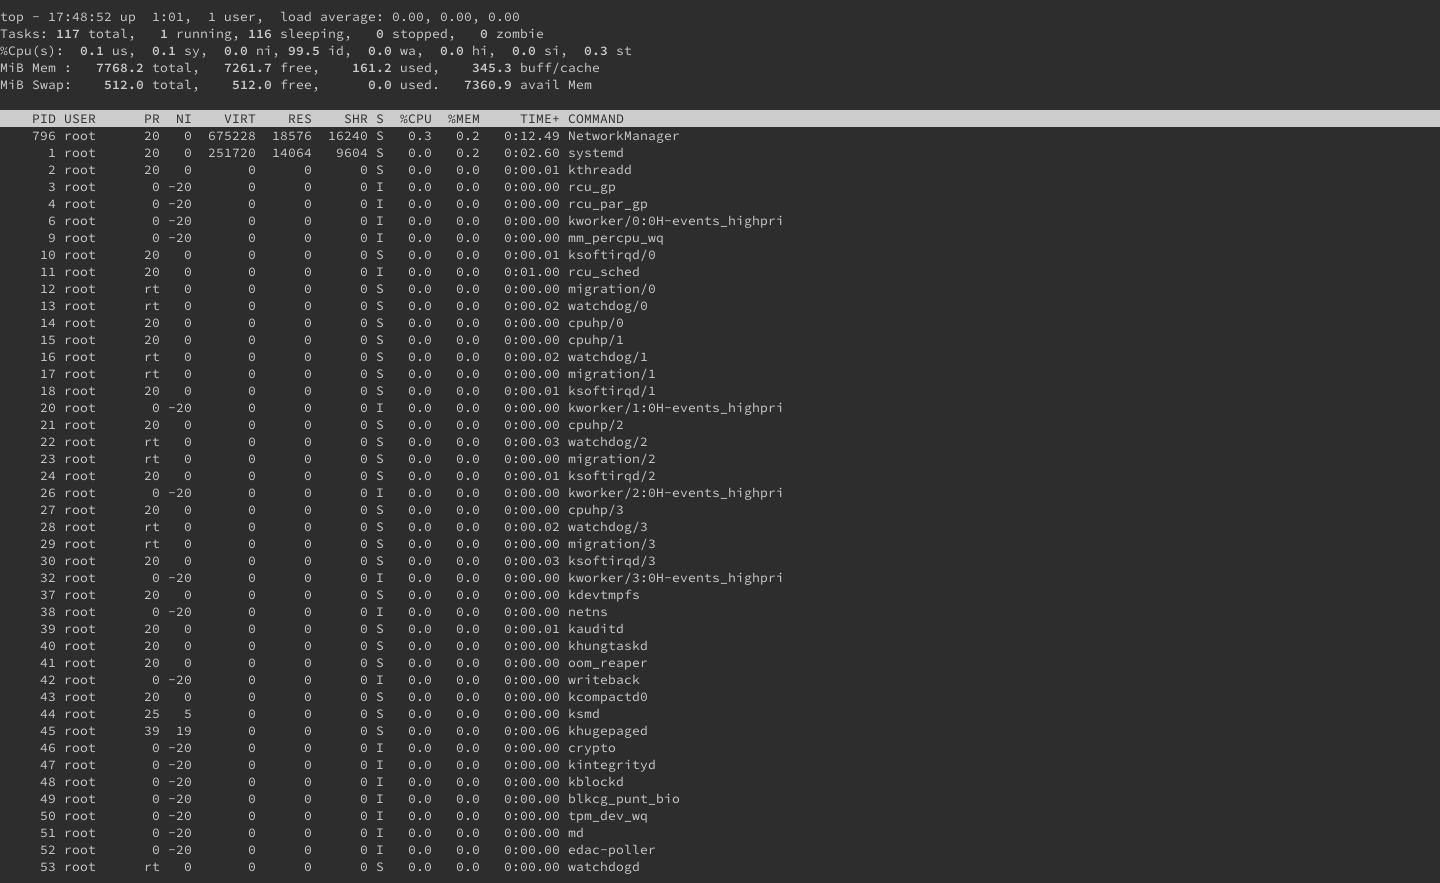
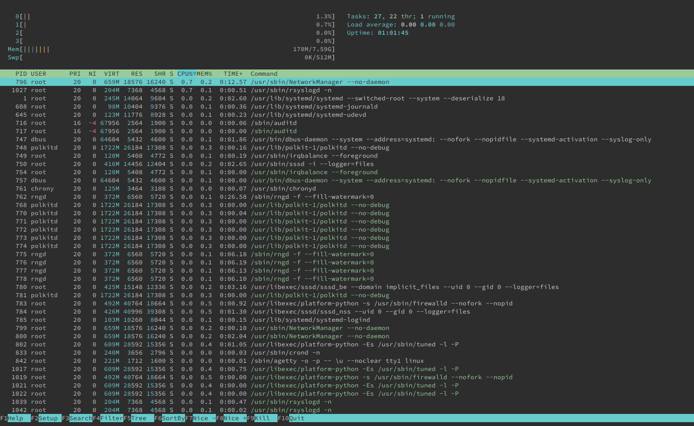
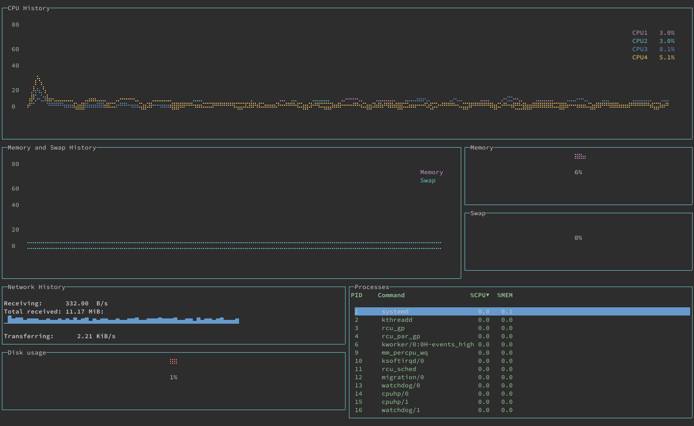
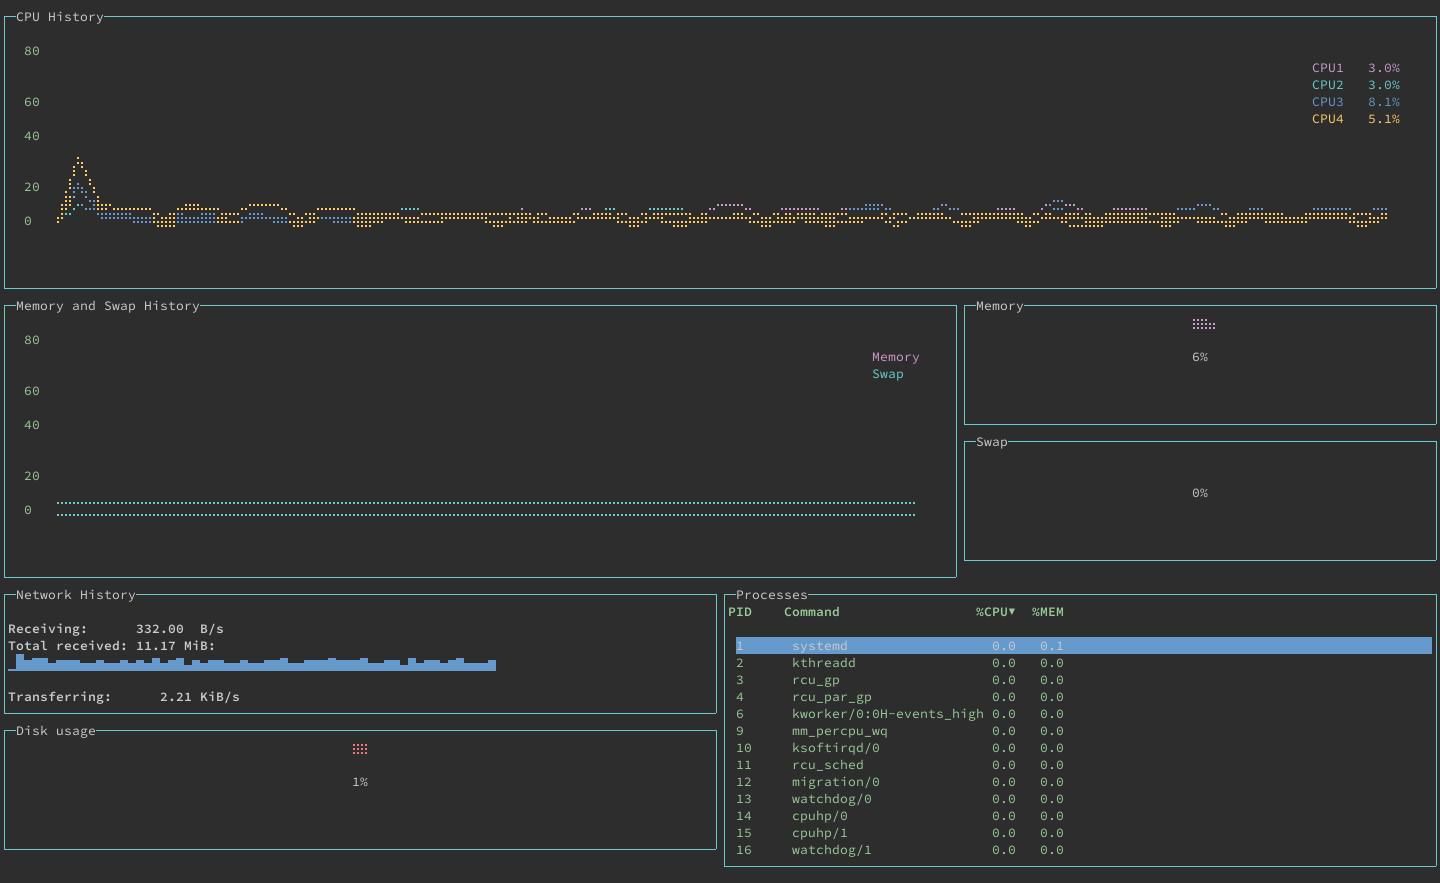
Take a look at the screenshots below, which contrast the displays of top, htop, and gtop.
top

htop

gtop

How to Install gtop
In order to install gtop you need to instal the Node Package Manager (npm). This section shows you how to install npm, using the Node Version Manager (nvm), and then, how to install gtop.
You can use the following commands to install nvm and then use it to install the current version of Node (which includes npm). You may want to consult the nvm installation guide and replace
v0.38.0below with the latest version you see in the guide.curl -o- https://raw.githubusercontent.com/nvm-sh/nvm/v0.38.0/install.sh | bash source ~/.bashrc nvm install nodeYou can then verify your npm installation with using the
--versionoption.npm --version7.21.0Install gtop using npm. Use the
-goption to install gtop as a global system package.npm install gtop -g
How to Use gtop
One advantage of gtop is that, despite its graphical display, it is a straight-forward system monitoring application. When you run gtop it immediately starts showing your system’s usage and process information.
gtop
What follows is a breakdown of the parts, or widgets, of the gtop display. You can refer to the screenshots in the What is gtop? section above to follow along.
- CPU History displays a graph of CPU usage over the last minute. Each line on the graph represents one of your system’s CPUs. In addition, the right side of the widget includes the current percentage usage for each CPU.
- Memory and Swap History provides the same graphical information but for your system’s memory, both physical and swap.
- The Memory and Swap widgets display the current percentage usage for physical memory and swap memory, respectively.
- Network History shows information related to network traffic and includes a graph of bytes-per-second being received over the last minute.
- The Disk Usage widget displays the current percentage of disk usage on the system.
- Processes gives you a simplified version of the process listing you could expect from the
topcommand.
Gtop is limited in its interactive options. You can navigate the Processes table with the up and down arrow keys. You can also control the table’s sort order. Press p key to sort by PID (process ID), c key to sort by CPU usage, and m key to sort by memory usage.
Conclusion
For all its simplicity, gtop provides an effective at-a-glance summary of your system. Tools like top and htop focus on providing more comprehensive information about running processes — and, in the case of htop, more control of those processes. Gtop excels if you want to be able to quickly gather your system’s current performance.
Do you like the graphical system monitoring of gtop but want more control and customization? You may want to check out bottom in that case, which takes the visual direction of gtop and gives you more control. Take a look at our guide
How to Install and Use bottom to learn more.
More Information
You may wish to consult the following resources for additional information on this topic. While these are provided in the hope that they will be useful, please note that we cannot vouch for the accuracy or timeliness of externally hosted materials.
This page was originally published on

